Dow Jones Target at 50,000? Technical Analysis Says It's Possible...
The Dow
Jones Industrial Average (DJIA) has been facing a challenging economic
landscape in the United States, characterized by rising inflation, increasing
interest rates, and a weakening dollar index.
Additionally,
the recent credit rating downgrade by Fitch has added to the uncertainty.
Despite these economic problems, a technical analysis of the DJIA's weekly
chart indicates a potential bull case scenario.
This
article deep dives into the historical patterns and technical indicators to
assess whether the DJIA can reach the milestone of 50,000 in the long term.
While the
chart patterns suggest a bullish scenario, investors must be cautious and
consider the economic risks before making investment decisions.
The
Technical Analysis Says...
History
Repeats Itself
One of the
fundamental principles in technical analysis is the belief that history tends
to repeat itself. This means that past price patterns and trends often reoccur
in the future, allowing chartists to identify potential trading opportunities.
Comparing
the current weekly chart with the historical data, 2016 to identify
similarities in market behaviour and potential recurring patterns.
Weekly
Chart 1

As we
analyse the weekly chart in 2023, it appears to mirror what we observed in
2016. The recent breakout on the price action, coupled with a bullish range
shift, provides confirmation of the resumption of a bullish trend following an
extended period of consolidation.
Drawing
from historical data, we find that after the bullish breakout in 2016, the
index experienced a remarkable rally of over 45%. Applying this percentage to
the recent breakout level suggests an approximate long-term target of 50,000.
This projection provides an exciting prospect for investors and market
participants alike.
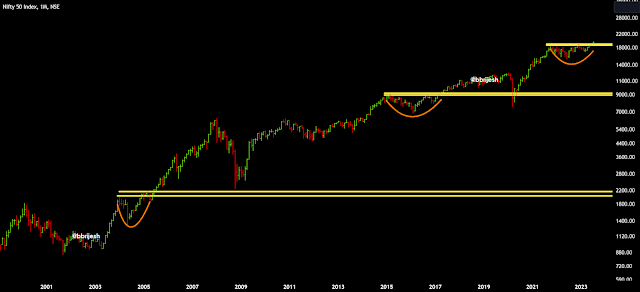
Weekly
Chart 2

The second chart reveals multiple bullish head and shoulders patterns, which are indicative of the bulls being in control of the prevailing trend.
The presence of these patterns suggests that the market sentiment is predominantly optimistic, with buyers exerting significant influence. Moreover, the break and subsequent retest at the neckline level, which lies within the range of 34,400-35,000, can serve as a potential accumulation zone.
The formation on bullish head and shoulders at 200WEMA (Weekly Exponential Moving Average) marked by orange on charts adds the bullish strength to the patterns.
The
multiple occurrences of this bullish pattern on the chart underscore the
strength of the bullish sentiment, reaffirming the likelihood of further upward
movement in the market.
While the
target of 50,000 seems promising based on historical trends and technical
analysis, investors must also take into account the existing economic risks and
exercise prudent risk management strategies.
Note: This
comprehensive report is intended for informational purposes only and should not
be considered as financial advice. Investors should conduct thorough research
and seek professional guidance before making any investment decisions.
What is your view on Dow Jones, write in the comment below.

Comments
Post a Comment