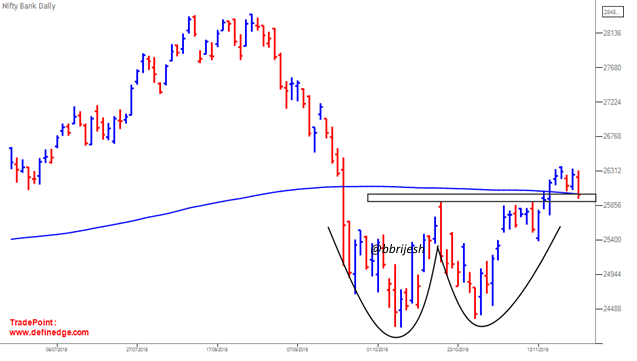
Bank Nifty - Bullish Setup
Chart
1 (Bar Chart):
·
The
bullish reversal pattern called double bottom is visible on daily chart.
·
Index
retested the breakout level at 25,915 last week and resuming its northwards
journey.
·
The
200DMA (Daily Moving Average) is placed right at the retest level of 26,004 and
also the key psychological level.
Chart
2 (P&F Chart):
·
The 1% X
3 Point & Figure (P&F) chart also called as X-O charting indicating the
bullish setup on index.
·
The
black trendlines – horizontal and rising on chart below are indicating the
trend is bullish.
·
Double
top – the bullish pattern on
chart suggests the fresh momentum (marked green). It the first bullish breakout
after August 2018.
·
The red
arrows are signaling higher high – higher low formation which is again – the
bullish sign.
·
The
brown line indicates the previous low is or O is well respected the breakout
post support are generally the strongest one.


Comments
Post a Comment